
I’m not sure Three Kings Day is going to deliver any epiphanic moments for financial market watchers but I’m keeping an eye on three things. As always, the cost of money is the real driver of markets but I’m going to assume the key Central Banks will continue to be Omicron cautious about hiking interest rates. So, let’s take a look(up) at a few charts knowing that the data rarely lies….
Digital Currencies: It has been a tough start to the year for cryptocurrency traders but I am watching the overall size of the market. As the digital currency market grows it makes it more and more difficult for asset managers, banks and regulators to ignore. So, check out the $18 trillion worth of cryptocurrencies traded on exchanges last year and the whopping 873% growth compared to 2020 activity levels(source: CryptoRank). We have heard of banks being “too big to fail” but could digital currencies now be an asset class too big to avoid?

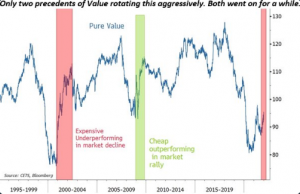
Growth: Growth stocks have had a fantastic run since the last financial crisis. The technology sector and FAANG stocks have been significant drivers of the “growth” style but long-suffering value investors had a pretty good 2021 with a decent recovery in old economy energy, financial and mining stocks. All fine so far, but my risk radar pings a bit louder when there is a sudden violent rotation from growth into value ie technology(Nasdaq) clobbered and cheap low-growth stocks holding up well. The last 3 days of trading have seen a very aggressive switch out of growth. In fact, this is the strongest style/factor shift since 2009 and almost as big as that seen when the dotcom bubble burst in 2000. In both instances growth stocks gave up market leadership for a significant period. Just sayin’……. See the chart(source: Bloomberg).
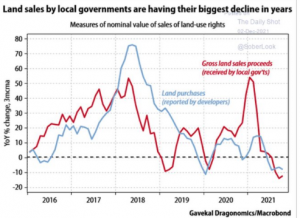
China Property: The travails of Evergrande and its $300 billion debt pile attached to its property development empire are well documented. However, there is an increasing sense that this is not a company specific story. The Chinese authorities have an impossible choice between reducing building activity to stabilise property prices and slowing overall economic activity with damaging political implications. Industry estimates suggest that there are between 65 and 80 million empty residences in China. The lead indicators for future development activity are land sales by local government (need revenues!) and land purchases by developers. Both have now plunged into negative growth territory per the chart below (source: Gavekal/Macrobond):
These are not necessarily the biggest investment considerations in the world today. There is no doubt that inflation fears, Russia/Ukraine tensions and Omicron pandemic disruption are capable of significant impact. However, the three charts above have the potential to gather momentum and impact broader markets very quickly. Watch carefully.